
The number one mistake I see with forecasts is that people create a forecast that just increases revenue by X percent each month. Here are the reasons why this is bad –
- It is hard to explain your business to investors. The first question they will want to know is how you will grow your business X% each month and your forecast should show them how.
- You do not understand the drivers of your business and do not know which areas of your business to invest in to grow the fastest and cheapest. Drivers are the key assumptions such as cost to acquire a customer or revenue / customer. They can vary by sales channel or customer type and once you understand them you can figure out if you should increase or your web marketing spend or networking events spend. When you understand your drivers you will know why you missed or exceeded your sales forecast and be able to learn from mistakes.
Here are 5 easy steps for how to create a driver based sales forecast so that you can explain your plan to investors and grow your business successfully –
- Describe your different sales funnels. Here are 2 common examples –
- Advertise on Web – Pay google, FB, yelp, or other website money to send people to your website each time they click on your add. Typically this is in the $1 to $5 per click range but each website or keyword is different. It will also hopefully improve over time as you AB test different strategies and figure out which one is working best. Once people are there a certain percent will buy your product – lets assume 2%.
- Networking – Pay to go conferences and meet potential clients. Once airfare, hotels, and conference fees are factored in this might cost $1000 per conference. Set a goal and see how many clients you can get out of each conference – A good goal might be 10 people.
- Determine the sales drivers and variables of your sales funnel.
- Drivers are the key assumptions that drive the model such as cost per click, website conversions, cost per conference. They can change over time and will be your key to understanding your business and figuring out where to invest more money. In the example below they are highlighted in yellow.
- Variables are the inputs for how you scale your business. In the example below they are highlighted in blue and we made the assumption that you would double your marketing spend every month
- Determine the revenue drivers – these are usually sales and revenue / sale.
- Create a multi month forecast and think about how your business will change over time. In our example we assumed that the cost / click would decrease as the business better determined which web channels (FB, yelp, google, etc) worked the best and which a ads worked the best. As the cost / click decreased we assumed that the business would spend more on web advertising than conferences.
- Measure actuals and do a variance analysis each month. When you miss your forecast figure out why you missed. Once you understand the why you can change the drivers to more accurately reflect your business.
Here is an example –
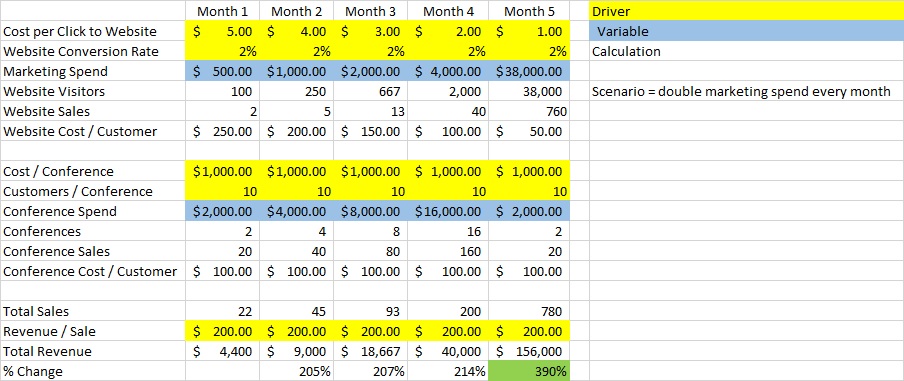
Conclusion – In this example the most important thing is to see how the drivers and variables highlighted in yellow and blue drive the model. This is crucial because now you will understand why your revenue increased 390% (highlighted in green), when you were only running at 200% increases each month prior. The reason is that your cost per click driver decreased as you figured out which ads worked the best and you increased the % of marketing spend in your most profitable channel = web sales.
If you would like me to send you a copy of the spreadsheet example or have any questions, then please send me an email to paul@financepals.com.